Because this study involves the comparison of three different funds, I've rolled all the records in together into one sheet. The is an early prototype of something larger I'm working on (and is also the first attempt at a piano-roll representation as first suggested by popeJohn). Overall with the data we are moving to a higher level view, where the picture changes to look at the production runs of the silver bars, and basically 'where are they now?'.
Because of the sheer number of data points, I've had to condense it into Monthly segments. This means that the system looks for vault matches and takes the maximum date value. i.e. if we see a bar in one vault on 15th of the month, and on the 30th it is in Goldmoney, then the goldmoney vault will be shown (so there is some loss of resolution and it would be possible to do a weekly or daily version of the same graph, but I'm saving this for some better charts later). First spreadsheet has conditional formatting, requires Excel 2007 or greater. Click on the icon for the cloud copy.
| 20120920_BV_GM_SLV.xlsx | 20120920_RAW_DATA.csv |
The data set is a total of 1,970 bars, selected by "Found in SLV ALSO Found in (Bullionvault + Goldmoney) FOR ALL DATA". We can potentially ignore about 25% of these because the of the low number of characters in the serial number increasing noise (refer 'complexity index' at the end of this page) but I've put these as numbers in the spread sheet so that records can be filtered out as you prefer. Being ultra conservative, let's ignore anything with a complexity index of 10 or less. By my count this leaves us with about 850 Bullionvault jumpers (~7.8% of their total silver inventory) and 93 Goldmoney jumpers (~1% of their London holdings), which are the figures I use on the main article. If we include the entire set of 1,970 then the figures are higher - BV 14.7 % and GM 4.4 % (london holdings).
Because we're interested in the vaults, for something different, the main work sheet actually tracks the vault, but each cell is color coded to represent the fund it belongs to. So far my color scheme is as follows: Blue = iShares SLV, Yellow = Goldmoney, Red = Bullionvault
A clearer picture emerges when you're just working with the high complexity matches. Here's what the spreadsheet looks like when zoomed out and filtered for a high complexity index:

Primary Observations and Interpretations:
1. Of these 1,970 matches, most came from the JPM London Vaults, the distribution is shown below in a really quick Excel pie chart. A careful eye will note the total here is greater than 1,970, which means that we do get some internal SLV vault jumping going on (aka. Loyal Vault Jumpers). These do show up in the data, but they are not the specific focus of this study so I won't be talking about it.

2. We get to see a technical example of Fund Switchers (only 5). If your interested, the BarID values of these are as follows (you can search for them in Column 1, but they are not highlighted).
BarID: 626262, 626266, 626264, 626265, 626263
What you should know about this is that InnerMongolia bars tend to use the same serial number sequence for different years, so it's not surprising these only have a complexity index of 10, and suggests that these Fund Switchers are in fact different bars.
3. The big gap of red (BullionVault) between March - July 2012 is clearly seen, as discussed in SLV Database 4. Graphically, it's obvious that the gap could be filled in, but this is one of the limits of this particular chart, we simply don't have the data points available during that time sample. It's not a major issue and doesn't really affect what we're hunting for here.
4. The big line of blue (for SLV) in the starting column is present because it represents our earliest Feb-2010 document - but by March 2010 a lot of those ones have disappeared.
---------------------------------------------------------------------------------------
Not included in this data set:
The Hong Kong G4 Logistics vault are a relatively new vault addition to Goldmoney and because the document format is different to the VIA MAT one. While the task is not that huge, I haven't written an import filter for it yet because (
Limit of Reading Error - Gaps in the record:
The Goldmoney documents present a challenge because although they are consistent, there is still a large three-month-gap between each document issue (compare this with SLV document issue rate which is close to daily). Technically we do not know if during that time Goldmoney have gotten rid of all their bars and then bought them all back just before the quarter ends. I'm not advancing that as an argument, my point is we only get to see the data itself and while we can make some decent assumptions about reality, we must always check our bases. It's generally safe to assume that the goldmoney bars showing up every quarter on the bar list (including ones that have been there since 2001) are there as part of the permanent (non-moving) bar population and that the bar list is indeed just a quarterly 'yep they're still here' type of check. But when we do see a bar leave, we cannot be certain when it left - it may have been a few days after the most recent bar list issue, or a few days before the end of the quarter. It doesn't really matter, but for a serious study we must declare this as a potential limit of reading error.
Limit of reading error - Dodgy Source Files:
Overall, a large amount of error is already removed by the central refiners index. One thing that strikes me about the Via Mat data is the number of typographical variations coming through on the refiner brands - particularly when it comes to the Russian and Chinese bars (on record we have 11 variations on 'URALELECTROMED JSC RUSSIA').
Some PDF files including some of the historical files from Goldmoney are unreadable by my software due to the library they used to create the PDF document (apparently creating a PDF on a MAC using some old version of Quark Express will produce this anomaly). When it happens, the text file looks like this, and I get upset because this single file jams the intake queue and suddenly a few hours of additional work are required to get that data out.
 |
| Luckily for me, only about 4 PDF files have ever produced an extraction like this. |
I've had to use OCR software to do the text extraction which then needs cleaned up to be compatible with my import process. In the future I may work some method for flagging the relative quality of each source document, but for now this doesn't affect the current analysis - e.g. if the OCR screwed up then it would just produce a bar signature which sits out in the middle of nowhere and it would get ignored. But generally speaking the OCR is very accurate at number recognition which is the important part so for now I trust the conversion - especially since it would be too time consuming to check every page of the OCR results.
Limit of reading error - Natural Duplicates:
If we're not careful, some matches could show up based on the sheer quantity of records. Statistically, you can think of this as being in a massive crowd of people and figuring out what the chances are that someone shares your birthday. That chance of an exact match is narrowed down if you add the chances of also sharing the city you were born in, but the chance of a match is not fully eliminated.
For bars, there is a bias as well, since the weights are all kind of similar so even though most of the time we have 7 digits for the weight, they are all in a certain range. For the heck of it (just because I can), here's the histogram of distribution (weight) for all unique bar signatures I have on record from SLV, Perth Mint, Goldmoney, BullionVault, PSLV combined (you saw it here first), which in theory starts to give a refining-industry-level picture.
 |
| 10-ounce range, fits into classic bell-curve distribution. At first I thought the bars less than 750 ounces were an anomaly but I checked the data, they do exist. Additionally page 10 of the LBMA rules (October 2008) make an allowance: "Bars produced prior to 1st January 2008 having a weight in the former wider range of 500 to 1250 troy ounces will continue to be acceptable for the time being though it is expected that these will eventually be phased out when the number of such bars in the London vaults has declined to nearly zero". |
Introducting the "Complexity Index":
Anyway, the signature matches are always more reliable if the complexity of combinations is higher - a serial number is four digits long may ultimately produce a match based on repeats alone, so I have made an attempt to represent the complexity of the signature using the length of the serial number and precision of the weight value, as a complexity index. A low index means it's possible to find lots of matches (a bit like the 2009 Project Mayhem Zero Hedge SLV study where they loosened the signature to find the results they wanted) and a high index increases the certainty that we're looking at the same bar. For the minute, my index is extremely rudimentary, but I will develop it over time: signature complexity = (length of serial number) + (total digits for WeightGrossOz, including decimal places but with trailing zeros removed), and for today's data set, the following distribution:
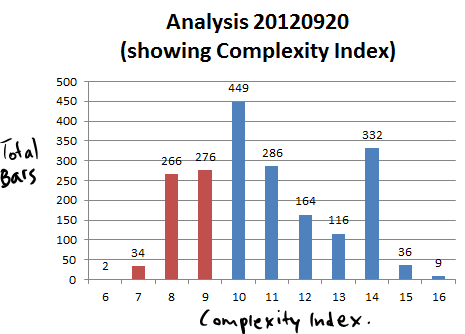 |
| Number of bars and complexity index, from the 1,970 bars set. |
This is encouraging to see so many 'high' numbers in the data. I have colored 9 and lower, because (for this version of the index) a reference point of 9 is a for 4-digit serial number SLV bar. Suggestions for a better index method are welcomed! Please do forward suggestions in the comments or contact me direct: bullionbars (at) hotmail (dot) com.
Source Documents and Fund Codes Explained:
On the main article SLV Database 4, I have described a little about the GoldMoney and BullionVault sources but I need to explain the code I'm using. Originally the database started with a 3-digit code for the source identifier (e.g. 'SLV') and the pattern got buried too deep in the code and database structure (oops), it meant I had to come up with a 3-digit code for each additional fund/source document. In the first six months it wasn't such a big deal until I decided to start storing the Goldmoney and Bullionvault files. Putting my thinking hat on, I came up with a code pattern which fits, but also helps identify it easily – basically here is the system:
first letterSo, GGH = “Goldmoney Gold Hong Kong”, BSL = “Bullionvault Silver London”, etc. The full list of funds is found on the ‘Funds’ worksheet in the spread sheet. The newer vaults (G4 International Logistics) screws this pattern up again - as does most things when trying to fit a round peg in a square hole, but for now the naming pattern works and the three-letter code — while obscure, is still convenient and I've kept it as a key structure.
G = Goldmoney
B = BullionVault
second letter
G = Gold
S = Silver
P = Platinum
D = Palladium
finally third letter
L = London
H = Hong Kong
Z = Zurich
No comments:
Post a Comment